create_funct_1d_pairs(:: XValues, YValues : Function)XValues(input_control)类型:实数或整数数组 (number(-array) → (real / integer))描述:这是输入的 X 值数组,代表了函数中每个点的横坐标位置。XValues 的长度决定了有多少个点将被用来构建该函数。YValues(input_control)类型:实数或整数数组 (number(-array) → (real / integer))描述:这是输入的 Y 值数组,代表了函数中每个点的纵坐标位置。YValues 应该与 XValues 具有相同的长度,因为它们是一一对应的,即每一个 X 值都有一个对应的 Y 值。Function(output_control)类型:一维函数 (function_1d → (real / integer))描述:这是输出的一维函数对象,它由提供的 (X, Y) 点对创建而成。此函数可以在后续的操作中使用,比如插值、查找极值、绘制图形等。
create_funct_1d_array 根据 y 值序列创建函数
create_funct_1d_array — Create a function from a sequence of y-values.YValues(input_control)类型:实数或整数数组 (number(-array) → (real / integer))描述:这是输入的 Y 值数组,代表了函数中每个点的纵坐标位置。YValues 应该与 XValues 具有相同的长度,因为它们是一一对应的,即每一个 X 值都有一个对应的 Y 值。Function(output_control)类型:一维函数 (function_1d → (real / integer))描述:这是输出的一维函数对象,它由提供的 (X, Y) 点对创建而成。此函数可以在后续的操作中使用,比如插值、查找极值、绘制图形等。
get_y_value_funct_1d(:: Function, X, Border : Y)Function(input_control)类型:一维函数 (function_1d → (real / integer))描述:这是输入的一维函数对象,它是由之前的算子如 create_funct_1d_pairs 创建的。该函数表示了你想要评估的数据分布。X(input_control)类型:实数或实数数组 (number(-array) → (real))描述:这是你希望评估函数值的位置(X 坐标)。可以是单个数值,也可以是一个数值数组,用于同时评估多个点。Border(input_control)类型:字符串 (string → (string))描述:定义了当 X 坐标超出原始数据范围时应该如何处理边界。选项包括:'constant':返回常数值(默认情况下为0)。'cyclic':以周期方式处理,即超出右边界则从左边界开始。'error':如果 X 超出范围,则抛出错误。'mirror':镜像处理,即超出范围的值会根据最近的有效值反射回来。'zero':返回0。默认值:'constant'Y(output_control)类型:实数或实数数组 (number(-array) → (real))描述:这是输出的 Y 值,表示在给定的 X 坐标处函数的值。如果输入的是一个 X 数组,则输出也将是一个对应的 Y 数组。
通过倾斜比测量缺陷
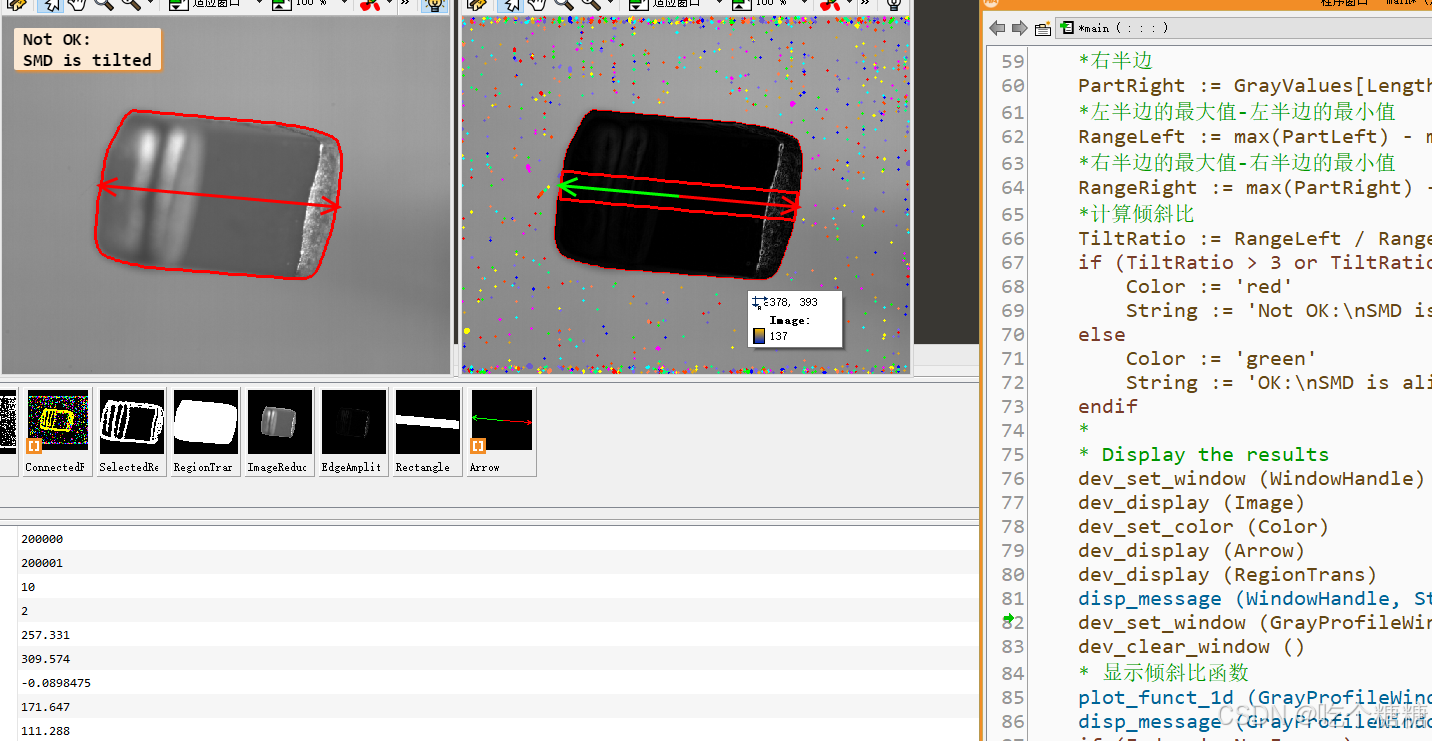
* This program checks if SMDs are nearly horizontal orif they
* are tilted with respect to the camera.* The images were taken with a small depth of field, therefore
* tilted SMDs are partly blurred.* First, the SMDs are segmented from the image. Then, the
* amplitudes of the edges(first derivatives of the gray values)* are computed. The edge amplitude is weak in blurred regions.* Therefore, tilted SMDs can be detected by comparing the edge
* amplitudes in the left and right parts of the SMDs.*dev_update_off()dev_close_window()dev_open_window(0,0,640*.7,512*.7,'black', WindowHandle)dev_set_draw('margin')dev_set_line_width(3)dev_open_window(0,640*.7+12,640*.7,512*.7,'black', GrayProfileWindow)set_display_font(WindowHandle,16,'mono','true','false')set_display_font(GrayProfileWindow,16,'mono','true','false')*
NumImages :=10for Index :=1 to NumImages by 1read_image(Image,'smd/smd_tilted_'+ Index$'02')** Segment the SMD* 阈值处理var_threshold(Image, Region,20,20,0.1,2,'dark')* 形成单独的连通域connection(Region, ConnectedRegions)* 筛选面积select_shape(ConnectedRegions, SelectedRegions,'area','and',15000,99999999)* 外接凸包区域shape_trans(SelectedRegions, RegionTrans,'convex')* 裁剪reduce_domain(Image, RegionTrans, ImageReduced)** Check if the SMD is tilted* Sobel滤波器检测边缘sobel_amp(ImageReduced, EdgeAmplitude,'sum_abs',3)* 获取边缘的最小矩形smallest_rectangle2(RegionTrans, Row, Column, Phi, Length1, Length2)*产生一共矩形gen_rectangle2(Rectangle, Row, Column, Phi, Length1 -3,20)* 产生一个测量矩形gen_measure_rectangle2(Row, Column, Phi, Length1 -3,20,640,512,'nearest_neighbor', MeasureHandle)* 获取测量矩形边缘的灰度值measure_projection(EdgeAmplitude, MeasureHandle, GrayValues)close_measure(MeasureHandle)*x 轴Sequence :=[1:|GrayValues|]*通过灰度值create_funct_1d_pairs(Sequence, GrayValues, Function)*产生箭头gen_arrow_contour_xld(Arrow,[Row,Row],[Column,Column],[Row - Length1 *sin(Phi),Row + Length1 *sin(Phi)],[Column + Length1 *cos(Phi),Column - Length1 *cos(Phi)],25,25)** Evaluate the edge amplitude of the SMD profileLength :=|GrayValues|*左半边PartLeft := GrayValues[0:Length /2]*右半边PartRight := GrayValues[Length /2:Length -1]*左半边的最大值-左半边的最小值RangeLeft :=max(PartLeft)-min(PartLeft)*右半边的最大值-右半边的最小值RangeRight :=max(PartRight)-min(PartRight)*计算倾斜比TiltRatio := RangeLeft / RangeRightif(TiltRatio >3or TiltRatio <1.0/3)Color :='red'String :='Not OK:\nSMD is tilted'elseColor :='green'String :='OK:\nSMD is aligned'endif** Display the resultsdev_set_window(WindowHandle)dev_display(Image)dev_set_color(Color)dev_display(Arrow)dev_display(RegionTrans)disp_message(WindowHandle, String,'window',12,12,'black','true')dev_set_window(GrayProfileWindow)dev_clear_window()* 显示倾斜比函数plot_funct_1d(GrayProfileWindow, Function,[],[], Color,'axes_color','none')disp_message(GrayProfileWindow,['Edge amplitude','Tilt ratio = '+ TiltRatio$'3.2f'],'window',12,12,'white','false')if(Index != NumImages)disp_continue_message(WindowHandle,'black','true')stop()endif
endfor
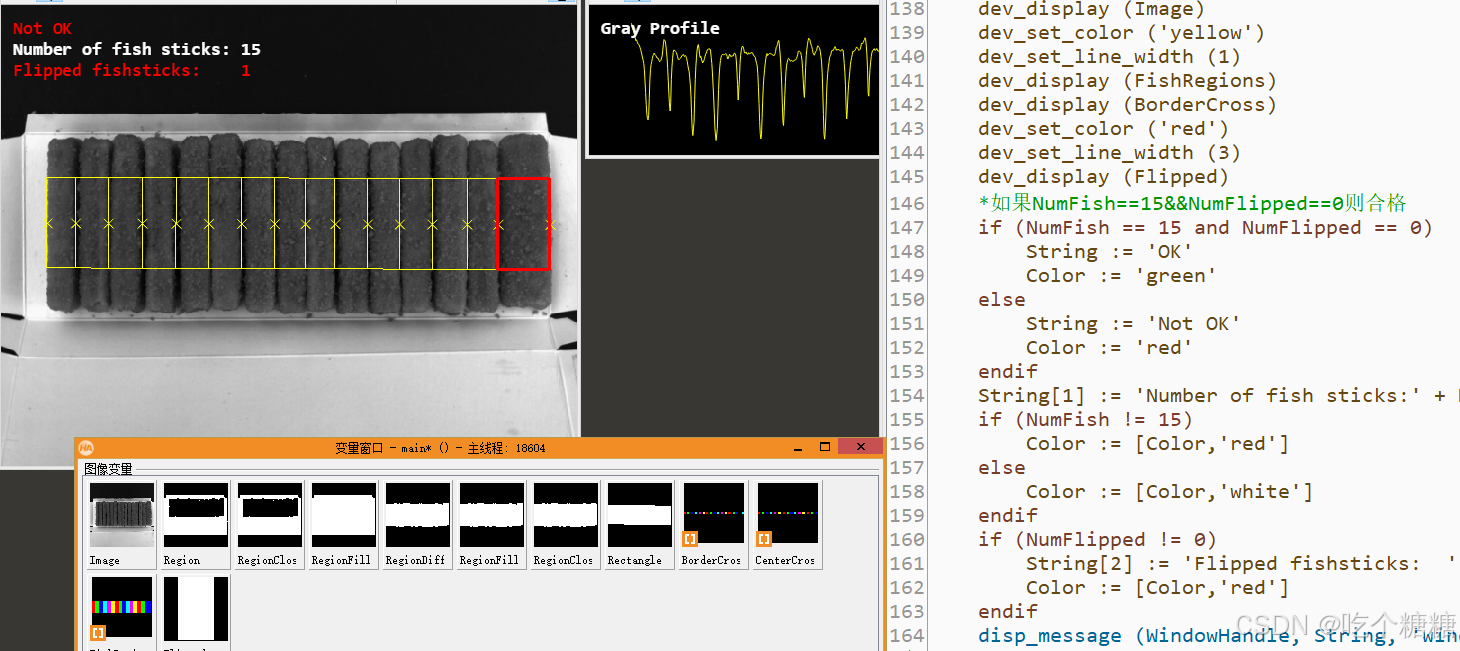
通过插值大小找缺陷
dev_update_off()dev_close_window()read_image(Image,'food/fish_stick_package_01')get_image_size(Image, Width, Height)dev_open_window(0,0, Width *.9, Height *.9,'black', WindowHandle)set_display_font(WindowHandle,16,'mono','true','false')dev_set_draw('margin')dev_open_window(0, Width *.9+12,420,150,'black', GraphicsWindow)set_display_font(GraphicsWindow,16,'mono','true','false')dev_set_color('yellow')** Read and process the images
NumImages :=6for Index :=1 to NumImages by 1* 读取图片read_image(Image,'food/fish_stick_package_'+ Index$'02')** Segment the content of the fish stick package*阈值处理threshold(Image, Region,100,255)* 闭运算closing_circle(Region, RegionClosing,5)* 填充fill_up(RegionClosing, RegionFillUp)* 区分出不同的两个区域difference(RegionFillUp, RegionClosing, RegionDifference)* 区域填充fill_up(RegionDifference, RegionFillUp1)* 闭运算closing_circle(RegionFillUp1, RegionClosing1,10)* 产生最小外接矩形smallest_rectangle2(RegionClosing1, Row, Column, Phi, Length1, Length2)MeasureLength1 := Length1 -5** Measure the gray value profile of the fish stick package* 产生矩形gen_rectangle2(Rectangle, Row, Column, Phi, Length1,80)* 将矩形测量gen_measure_rectangle2(Row, Column, Phi, MeasureLength1,60, Width, Height,'nearest_neighbor', MeasureHandle)* 朝着测量的方向获取灰度值measure_projection(Image, MeasureHandle, GrayValues)close_measure(MeasureHandle)* 创建坐标create_funct_1d_array(GrayValues, Function)* 计算极值点local_min_max_funct_1d(Function,'plateaus_center','true', Minima, Maxima)** Evaluate the gray profile* 获取极值点上y点的值get_y_value_funct_1d(Function, Minima,'mirror', YValues)* 计算符号函数的结果Signs :=sgn(YValues -50)*sgn 是符号函数(sign function),它返回:*-1 如果参数小于 0,*0 如果参数等于 0,*+1 如果参数大于 0。* 查找所有 YValues 小于 50 的索引Indices :=find(Signs,-1)*subset 函数根据给定的索引列表从一个数组中提取子集。*在这个例子中,它将从 Minima 数组中提取那些索引对应于 YValues 小于 50 的元素。* 根据索引从 Minima 中选择对应的最小值点SelectedMinima :=subset(Minima, Indices)*选择缩影中对应的Minima的最小值SelectedMinima :=subset(Minima,find(sgn(YValues -50),-1))* 获取索引个数Num :=|SelectedMinima|+1* 存储在数组中第一个元素是-5StickEdges :=[-5,SelectedMinima,2* MeasureLength1 +5]* 计算相邻元素的差值StickWidth := StickEdges[1:Num]- StickEdges[0:Num -1]** Display the results* 获取 Num 的值
*Num :=|StickEdges|-1* 检查 Num 是否有效
*if(Num <1)*dev_message_box('Not enough elements in StickEdges to compute CenterX and CenterY.', 'error', ['Ok'], DefaultWindow)*else* 计算边界点*BorderX := Column +cos(Phi)*(StickEdges - MeasureLength1)*BorderY := Row -sin(Phi)*(StickEdges - MeasureLength1)* 计算中心点*CenterX :=(BorderX[1:Num]+ BorderX[0:Num -1])/2*CenterY :=(BorderY[1:Num]+ BorderY[0:Num -1])/2* 显示结果以进行验证*dev_message_box('CenterX array: '+ CenterX,'information',['Ok'], DefaultWindow)*dev_message_box('CenterY array: '+ CenterY,'information',['Ok'], DefaultWindow)*endif*计算边界点BorderX := Column +cos(Phi)*(MeasureLength1 *((StickEdges - MeasureLength1)/ MeasureLength1))BorderY := Row -sin(Phi)*(MeasureLength1 *((StickEdges - MeasureLength1)/ MeasureLength1))*计算中点CenterX :=(BorderX[1:Num]+ BorderX[0:Num -1])/2CenterY :=(BorderY[1:Num]+ BorderY[0:Num -1])/2*绘制标记gen_cross_contour_xld(BorderCross, BorderY, BorderX,15,rad(45))gen_cross_contour_xld(CenterCross, CenterY, CenterX,15,rad(45))*找出相邻元素大于20的点,大于返回1小于返回-1IndexFish :=find(sgn(StickWidth -20),1)if(IndexFish !=-1)NumFish :=|IndexFish|*绘制矩形gen_rectangle2(FishRegions,subset(CenterY,IndexFish),subset(CenterX,IndexFish),gen_tuple_const(NumFish,Phi),subset(StickWidth,IndexFish)/2,gen_tuple_const(NumFish,Length2)/2)elseNumFish :=0endif*产生一个空的区域gen_empty_region(Flipped)*寻找边缘大于48的点,大于则是返回1,小于则返回-1IndexFlipped :=find(sgn(StickWidth -48),1)if(IndexFlipped !=-1)*返回数组的长度NumFlipped :=|IndexFlipped|*产生矩形gen_rectangle2(Flipped,subset(CenterY,IndexFlipped),subset(CenterX,IndexFlipped),gen_tuple_const(NumFlipped,Phi),subset(StickWidth,IndexFlipped)/2,gen_tuple_const(NumFlipped,Length2)/2)elseNumFlipped :=0endif*dev_set_window(GraphicsWindow)dev_clear_window()* 绘制函数图像plot_funct_1d(GraphicsWindow, Function,[],[],'yellow','axes_color','none')*显示disp_message(GraphicsWindow,'Gray Profile','window',12,12,'white','false')dev_set_window(WindowHandle)dev_clear_window()dev_display(Image)dev_set_color('yellow')dev_set_line_width(1)dev_display(FishRegions)dev_display(BorderCross)dev_set_color('red')dev_set_line_width(3)dev_display(Flipped)*如果NumFish==15&&NumFlipped==0则合格if(NumFish ==15and NumFlipped ==0)String :='OK'Color :='green'elseString :='Not OK'Color :='red'endifString[1]:='Number of fish sticks:'+ NumFish$'3'if(NumFish !=15)Color :=[Color,'red']elseColor :=[Color,'white']endifif(NumFlipped !=0)String[2]:='Flipped fishsticks: '+ NumFlipped$'3'Color :=[Color,'red']endifdisp_message(WindowHandle, String,'window',12,12, Color,'false')dev_set_color(Color[0])dev_display(Rectangle)if(Index < NumImages)disp_continue_message(WindowHandle,'black','true')stop()endif
endfor