
Prometheus 简介
Prometheus起源
-
Prometheus受启发于Google的Brogmon监控系统(相似的Kubernetes是从Google的Brog系统演变而来),从2012年开始由前Google工程师在Soundcloud以开源软件的形式进行研发,并且于2015年早期对外发布早期版本。2016年5月继Kubernetes之后成为第二个正式加入CNCF基金会的项目,同年6月正式发布1.0版本。2017年底发布了基于全新存储层的2.0版本,能更好地与容器平台、云平台配合。
Prometheus 原理架构图
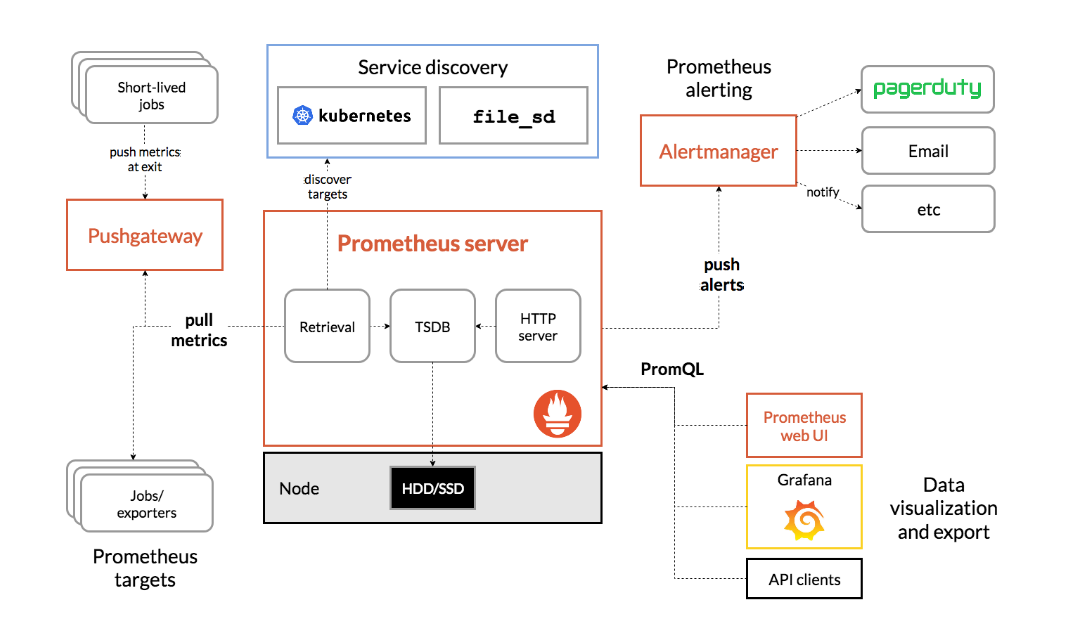
Prometheus 基本原理
Prometheus是一个开源的系统监控和警报工具,它的基本原理包括:
-
数据抓取: Prometheus Server 主动通过HTTP协议周期性地抓取被监控组件的状态数据。
-
Exporters: 被监控组件通过Exporter暴露其监控数据。Exporter是一个轻量级的程序,它运行在被监控的服务器上,将被监控的数据转换为Prometheus能够理解的格式。
-
多维数据模型: Prometheus使用多维数据模型,数据由指标名和键值对标签组成,这使得它能够提供灵活的数据查询和聚合。
-
数据存储: Prometheus Server将采集到的数据存储在本地的时序数据库中。
-
查询语言: Prometheus提供了强大的PromQL查询语言,用于查询和分析监控数据。
-
可视化与警报: 通过Grafana等工具进行数据可视化,以及通过Alertmanager进行警报管理。
K8S中安装Prometheus

grafana-deployment.yaml
[root@k8s-master apply]# cat grafana-deployment.yaml
# Deployment
apiVersion: apps/v1
kind: Deployment
metadata:name: grafananamespace: monitoring
spec:replicas: 1selector:matchLabels:app: grafanatemplate:metadata:labels:app: grafanaspec:containers:- name: grafanaimage: grafana/grafana:9.5.2ports:- containerPort: 3000readinessProbe:httpGet:path: /api/healthport: 3000initialDelaySeconds: 30timeoutSeconds: 5volumeMounts:- name: grafana-storagemountPath: /var/lib/grafana- name: grafana-datasourcesmountPath: /etc/grafana/provisioning/datasourcesvolumes:- name: grafana-storageemptyDir: {}- name: grafana-datasourcesconfigMap:name: grafana-datasources---
# DataSource ConfigMap
apiVersion: v1
kind: ConfigMap
metadata:name: grafana-datasourcesnamespace: monitoring
data:datasources.yaml: |apiVersion: 1datasources:- name: Prometheustype: prometheusaccess: proxyurl: http://prometheus.monitoring.svc.cluster.local:9090isDefault: true---
# Service
apiVersion: v1
kind: Service
metadata:name: grafananamespace: monitoring
spec:type: NodePortselector:app: grafanaports:- port: 3000targetPort: 3000nodePort: 30300
node_exporter_daemonset.yaml
[root@k8s-master apply]# cat node_exporter_daemonset.yaml
# DaemonSet + Service
apiVersion: apps/v1
kind: DaemonSet
metadata:name: node-exporternamespace: monitoringlabels:app: node-exporter
spec:selector:matchLabels:app: node-exportertemplate:metadata:labels:app: node-exporterspec:hostNetwork: truehostPID: truetolerations:- operator: Existscontainers:- name: node-exporterimage: prom/node-exporter:v1.6.1args:- --path.procfs=/host/proc- --path.sysfs=/host/sys- --no-collector.netdevports:- containerPort: 9100name: httpvolumeMounts:- name: procmountPath: /host/proc- name: sysmountPath: /host/sys- name: rootmountPath: /rootfsvolumes:- name: prochostPath:path: /proc- name: syshostPath:path: /sys- name: roothostPath:path: /---
apiVersion: v1
kind: Service
metadata:name: node-exporternamespace: monitoringlabels:app: node-exporter
spec:clusterIP: Noneselector:app: node-expo


