
今天在vue3中实现了两种罗盘图,先看效果:
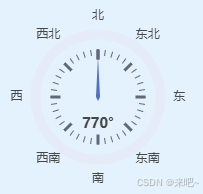
这个指针会动
第一种代码:
function direction() {let chart = echarts.init(document.getElementById("direction"));let startAngle = 90;let endAngle = 450;let option = {series: [{name: '方向表',type: 'gauge',detail: {formatter: '{value}°',textStyle: {       //color: 'auto',fontSize: 14,fontWeight: 'bolder'}},startAngle: startAngle,splitNumber: 8,endAngle: endAngle,min: 0,max: 360,axisLabel: {fontSize: 12,distance: -40,formatter: function (value) {const directions = ['北', '东北', '东', '东南', '南', '西南', '西', '西北'];const index = Math.floor((value + 22.5) / 45) % 8; // 计算当前值对应的方向索引,考虑ECharts的0度在右侧,需要调整return directions[index];}},pointer: {			  // 仪表盘指针width: 2},data: [{value: 270,//name: '西风'}]}]};// 把配置和数据放这里chart.setOption(option);window.onresize = function () {//自适应大小chart.resize();};// 使用刚指定的配置项和数据显示图表,加个定时生成,让你的仪表盘动起来let angle = 90;setInterval(function () {angle = angle + 5;option.series[0].data[0].value = angle;}, 2000);
}
另一个罗盘方向会动,指针始终在最上面:
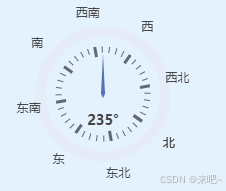
function direction1() {let chart = echarts.init(document.getElementById("direction1"));let startAngle = 90; // 初始时,北在上,即0度对应90度的位置(因为ECharts的0度是右侧)let endAngle = 450; // 结束角度,确保绘制一个完整的圆let option = {series: [{name: '方向表',type: 'gauge',detail: {formatter: '{value}°',textStyle: {fontSize: 14,fontWeight: 'bolder'}},startAngle: startAngle,splitNumber: 8,endAngle: endAngle,min: 0,max: 360,axisLabel: {fontSize: 12,distance: -40,formatter: function (value) {const directions = ['北', '东北', '东', '东南', '南', '西南', '西', '西北'];const index = Math.floor((value + 22.5) / 45) % 8; // 计算当前值对应的方向索引,考虑ECharts的0度在右侧,需要调整return directions[index];}},pointer: {width: 2},data: [{value: 90, // 初始值,例如东}]}]};chart.setOption(option);window.onresize = function () {chart.resize();};// 使用刚指定的配置项和数据显示图表,并添加定时更新角度的功能let currentValue = 90; // 当前值,初始为东setInterval(function () {currentValue = (currentValue + 5) % 360; // 更新当前值,确保它在0-360之间循环const newStartAngle = (currentValue + 90) % 360; // 计算新的开始角度,确保它在0-360之间option.series[0].startAngle = newStartAngle; option.series[0].endAngle = newStartAngle+360;option.series[0].data[0].value = currentValue; // 更新数据值chart.setOption(option, true); // 更新图表}, 2000);
}


