
环形图封装成了一个组件 组件名diagran.vue
<!--环形图-->
<template><div class='chartPreDonut' ref='chartPreDonut'></div>
</template><script>
import * as echarts from 'echarts'
export default {props: ['option', 'unit', 'title', 'center', 'legend', 'legendTop'],data () {return {chartDom: null,chartData: this.option}},watch: {option: {handler (val) {this.chartData = valthis.$nextTick(() => {this.chartInit()})},deep: true,immediate: true}},mounted () {this.$nextTick(() => {this.chartInit()})},methods: {chartInit () {this.chartDom = echarts.init(this.$refs.chartPreDonut)const options = {tooltip: {trigger: 'item',formatter: (params) => {return `${params.name}:${params.value}${this.unit || ''}${params.data.rate ? `<br /> 占比${params.percent}%` : ''}`}},series: [{type: 'pie',radius: ['30%', '50%'],clockwise: true,avoidLabelOverlap: true,hoverOffset: 15,label: {show: true,position: 'outside',formatter: (params) => {return `${params.name}:${params.value}${this.unit || ''}${params.data.rate ? `\n占比${params.percent}%` : ''}`},rich: {hr: {backgroundColor: 't',borderRadius: 3,width: 3,height: 3,padding: [3, 3, 0, -12]},a: {padding: [-30, 15, -20, 15]}}},labelLine: {normal: {length: 5,length2: 5,lineStyle: {width: 1}}},center: this.center || ['50%', '50%'],data: this.chartData}]}if (this.legend) {options.legend = {type: 'scroll',orient: 'vertical',right: 10,top: this.legendTop || 100,bottom: 20,data: this.chartData.map(m => { return m.name })}}if (this.title) {options.title = {text: this.title,top: '44%',textAlign: 'center',left: '49.50%',textStyle: {color: '#104fa7',fontSize: 15,fontWeight: '400'}}}this.chartDom.setOption(options)window.addEventListener('resize', () => {this.chartDom.resize()})}}
}
</script><style lang="less" scoped>
.chartPreDonut {width: 100%;height: 100%;
}
</style>
页面引入组件
<template><div><div class="left-charts"><Diagran :option='option' unit="人次" /></div></div>
</template><script>
import Diagran from './diagran.vue'
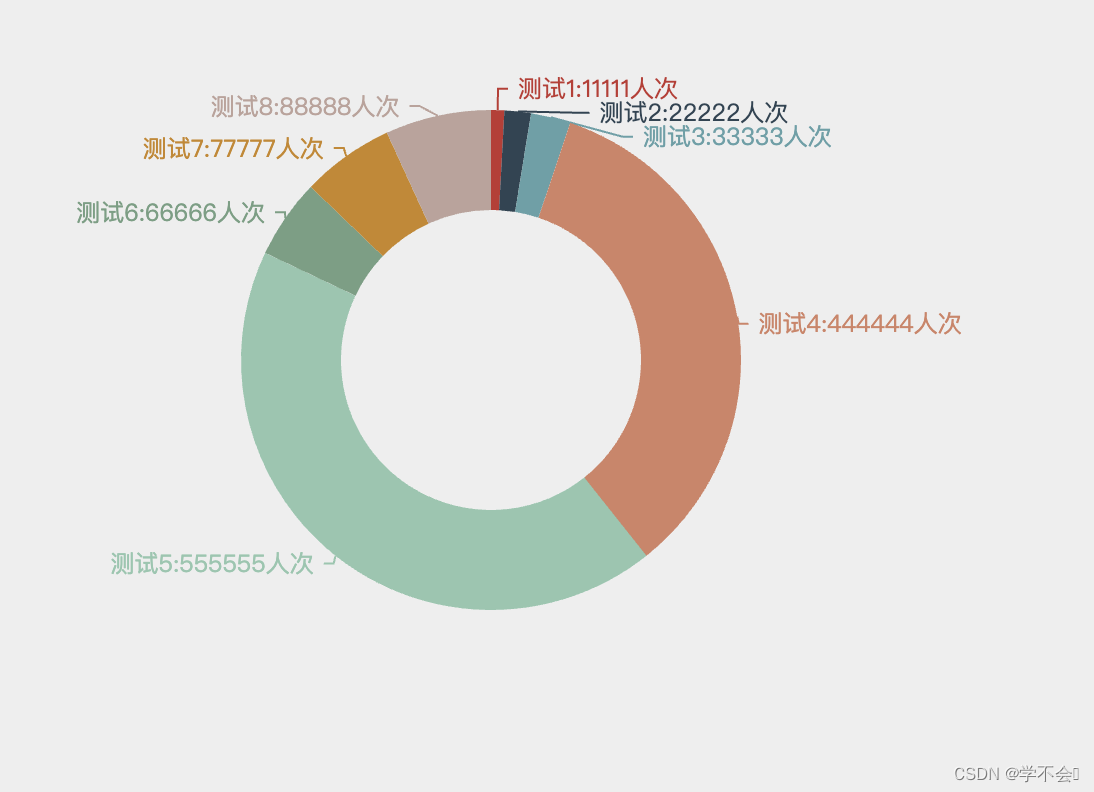
export default {data () {return {option: [{"value": 11111,"name": "测试1"},{"value": 22222,"name": "测试2"},{"value": 33333,"name": "测试3"},{"value": 444444,"name": "测试4"},{"value": 555555,"name": "测试5"},{"value": 66666,"name": "测试6"},{"value": 77777,"name": "测试7"},{"value": 88888,"name": "测试8"}]}},components: {Diagran}
}
</script><style lang="less" scoped>
.left-charts {width: calc(100% - 140px);height: 500px;
}
</style>


