%matplotlib inline
import numpy as np
from matplotlib_inline import backend_inline
from d2l import torch as d2l
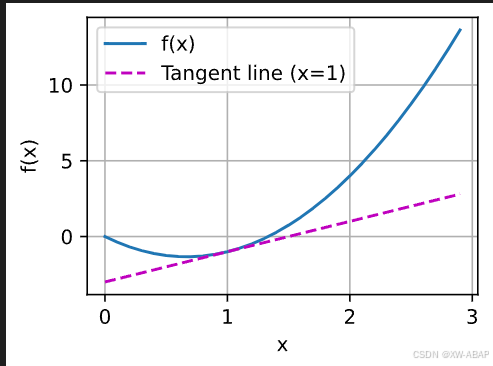
def f(x):return 3 * x ** 2 - 4 * x
def numerical_lim(f, x, h):return (f(x + h) - f(x)) / h
h = 0.1
for i in range(5):print(f'h={h:.5f}, numerical limit={numerical_lim(f, 1, h):.5f}')h *= 0.1
def use_svg_display(): """使用svg格式在Jupyter中显示绘图"""backend_inline.set_matplotlib_formats('svg')
def set_figsize(figsize=(3.5, 2.5)): """设置matplotlib的图表大小"""use_svg_display() d2l.plt.rcParams['figure.figsize'] = figsize
def set_axes(axes, xlabel, ylabel, xlim, ylim, xscale, yscale, legend):"""设置matplotlib的轴"""axes.set_xlabel(xlabel) axes.set_ylabel(ylabel) axes.set_xscale(xscale) axes.set_yscale(yscale) axes.set_xlim(xlim) axes.set_ylim(ylim) if legend: axes.legend(legend) axes.grid()
def plot(X, Y=None, xlabel=None, ylabel=None, legend=None, xlim=None,ylim=None, xscale='linear', yscale='linear',fmts=('-', 'm--', 'g-.', 'r:'), figsize=(3.5, 2.5), axes=None):"""绘制数据点"""if legend is None: legend = [] set_figsize(figsize) axes = axes if axes else d2l.plt.gca() def has_one_axis(X):return (hasattr(X, "ndim") and X.ndim == 1 or isinstance(X, list)and not hasattr(X[0], "__len__"))if has_one_axis(X): X = [X] if Y is None: X, Y = [[]] * len(X), X elif has_one_axis(Y): Y = [Y] if len(X) != len(Y): X = X * len(Y) axes.cla() for x, y, fmt in zip(X, Y, fmts): if len(x): axes.plot(x, y, fmt) else: axes.plot(y, fmt) set_axes(axes, xlabel, ylabel, xlim, ylim, xscale, yscale, legend)
x = np.arange(0, 3, 0.1)
plot(x, [f(x), 2 * x - 3], 'x', 'f(x)', legend=['f(x)', 'Tangent line (x=1)'])
h=0.10000, numerical limit=2.30000
h=0.01000, numerical limit=2.03000
h=0.00100, numerical limit=2.00300
h=0.00010, numerical limit=2.00030
h=0.00001, numerical limit=2.00003