Matplotlib是python的一个画图库,便于数据可视化。
安装命令
pip install matplotlib常用命令:
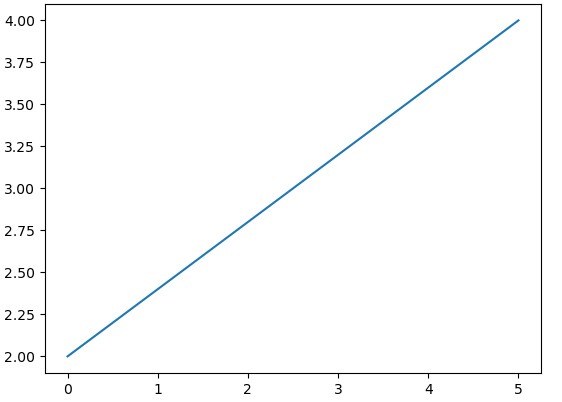
绘制直线,连接两个点
import matplotlib.pyplot as plt
plt.plot([0,5],[2,4])
plt.show()
运行结果如下:
多条线:
import numpy as np
import matplotlib.pyplot as plt
x=np.linspace(0,10,100)
plt.plot(x,x+0,'--g',label='--g')
plt.plot(x,x+1,'-.r',label='-.r')
plt.plot(x,x+2,':b',label=':b')
plt.plot(x,x+4,'.k',label='.k')
plt.plot(x,x+5,'*m',label='*m')
plt.legend(loc='upper left',fancybox=True,framealpha=1,shadow=True,borderpad=1)#图例位置,默认左上角,lower right右下角
plt.show()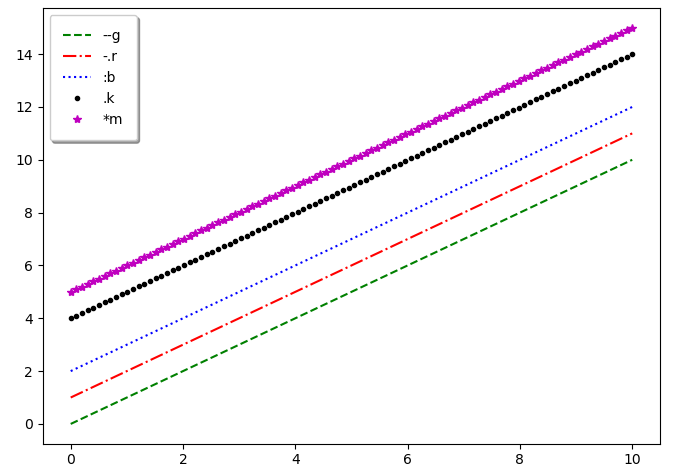
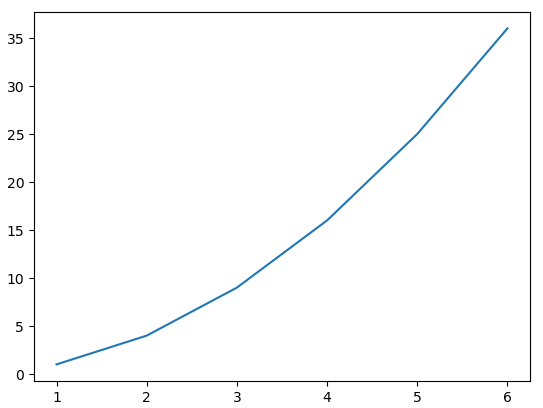
绘制折线:
import matplotlib.pyplot as plt
x = [1, 2, 3, 4, 5, 6]
y = []
for i in range(0, len(x)):y.append(x[i] ** 2)
print()
plt.plot(x,y)
plt.show()
运行结果如下:
设置样式
import matplotlib.pyplot as plt
x = [1, 2, 3, 4, 5, 6]
y = []
for i in range(0, len(x)):y.append(x[i] ** 2)
print()
plt.plot(x,y,linewidth=5)
plt.rcParams['font.sans-serif']=['SimHei']
plt.xlabel('X')
plt.ylabel('X的平方')
plt.title('折线图绘制')
plt.show()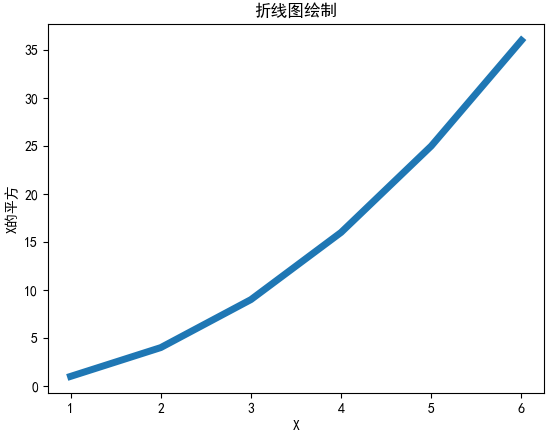
绘制曲线:
import numpy as np
import matplotlib.pyplot as plt
x=np.linspace(0,10,100)
sin_y=np.sin(x)
cos_y=np.cos(x)
plt.plot(x,sin_y)
plt.plot(x,cos_y)
plt.show()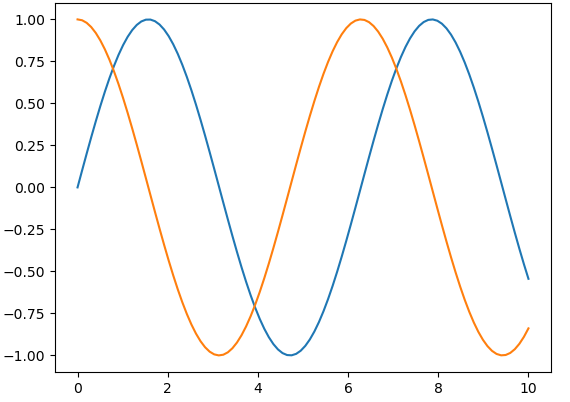
分区
plt.subplot(1,2,1)
plt.plot(x,sin_y)
plt.subplot(1,2,2)
plt.plot(x,cos_y)
plt.show()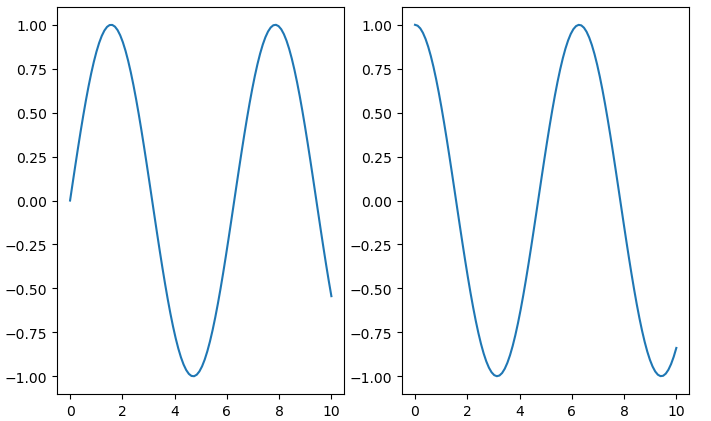
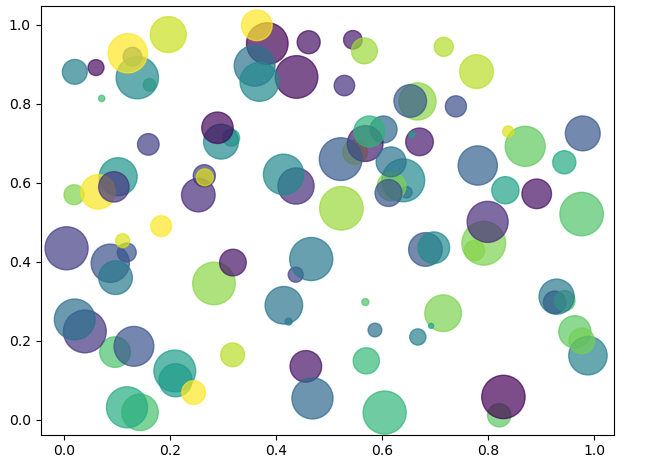
绘制散点图
import numpy as np
import matplotlib.pyplot as plt
np.random.seed(0)
x=np.random.rand(100)
y=np.random.rand(100)
#10size
size=np.random.rand(100)*1000
#100color
color=np.random.rand(100)
plt.scatter(x,y,s=size,c=color,alpha=0.7)#alpha透明度
plt.show()
运行结果如下:
条形图
import numpy as np
import matplotlib.pyplot as plt
plt.rcParams['font.sans-serif']=['SimHei']
x=[1995,2000,2005,2010,2015,2020]
x_label=['1995年','2000年','2005年','2010年','2015年','2020年']
y=[100,200,300,400,300,200]
plt.bar(x,y,width=3)
plt.xticks(x,x_label)
plt.xlabel('年份')
plt.ylabel('销量')
plt.show()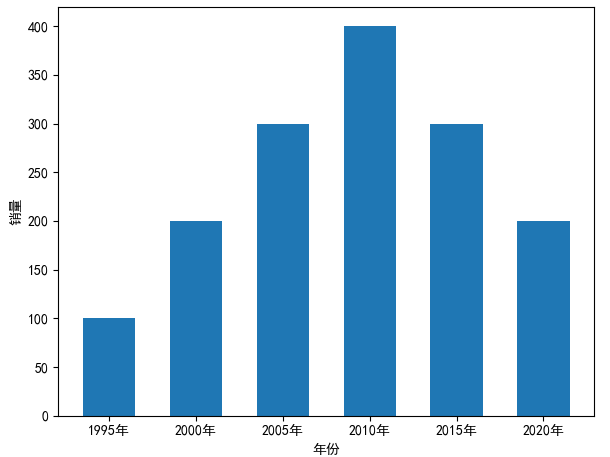
横向的条形图:
import numpy as np
import matplotlib.pyplot as plt
np.random.seed(0)
x=np.arange(6)
y=np.random.randint(-5,5,6)
v_bar=plt.barh(x,y,color='blue')
for bar,height in zip(v_bar,y):if height<0:bar.set(color='green')
plt.axvline(0)
plt.show()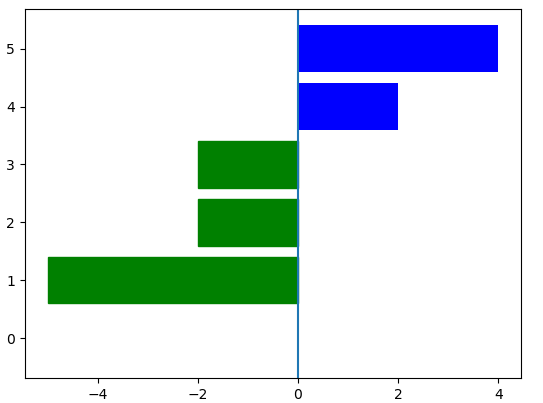
柱状图组合
import numpy as np
import matplotlib.pyplot as plt
plt.rcParams['font.sans-serif']=['SimHei']
real_names=['熊大','熊二','熊三']
real_num1=[7548,4013,1673]
real_num2=[5453,3840,1980]
real_num3=[1348,2345,1890]
x=np.arange(len(real_names))
width=0.3
plt.bar(x,real_num1,alpha=0.5,width=width,label=real_names[0])
plt.bar([i+width for i in x],real_num2,alpha=0.5,width=width,label=real_names[1])
plt.bar([i+2*width for i in x],real_num3,alpha=0.5,width=width,label=real_names[2])
x_label=['第{}天'.format(i+1) for i in x]
plt.xticks([i+width for i in x],x_label)
plt.title('柱状图组合')
plt.ylabel('数量')
plt.legend()
plt.show()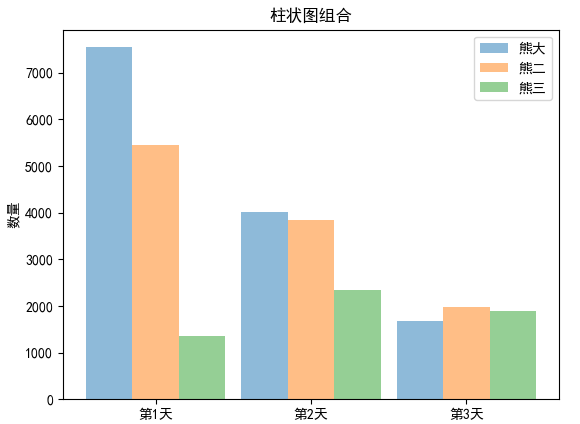
绘制直方图:
import numpy as np
import matplotlib.pyplot as plt
x=np.random.normal(0,1,1000)
y=np.random.normal(-2,1,1000)
z=np.random.normal(3,2,1000)
kwargs=dict(bins=100,alpha=0.5)
plt.hist(x,**kwargs)
plt.hist(y,**kwargs)
plt.hist(z,**kwargs)
plt.show()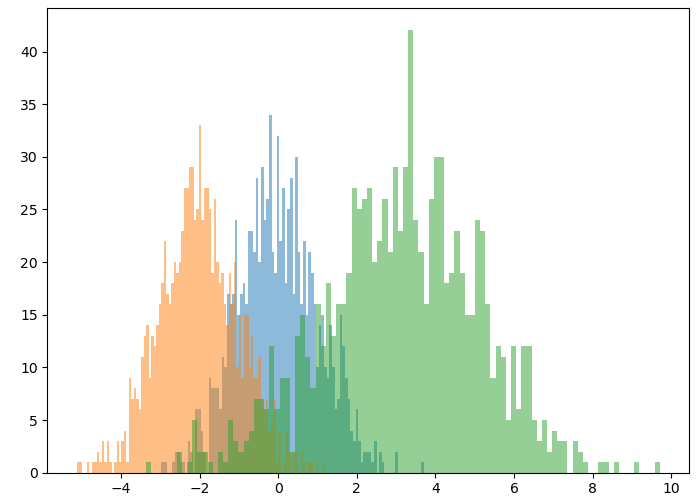
饼图:
import matplotlib.pyplot as plt
plt.rcParams['font.sans-serif']=['SimHei']
values = [15, 30, 45, 10]
total = sum(values)
sizes = [v / total for v in values]
labels = ['类别1', '类别2', '类别3', '类别4']
fig, ax = plt.subplots()
ax.pie(sizes, labels=labels, autopct='%1.1f%%', startangle=90)
ax.axis('equal')
plt.show()
等高线图:
import numpy as np
import matplotlib.pyplot as plt
x=np.linspace(-10,10,100)
y=np.linspace(-10,10,100)
X,Y=np.meshgrid(x,y)
Z=np.sqrt(X**2+Y**2)
plt.contourf(X,Y,Z)
#plt.contour(X,Y,Z) #不填充的
plt.show()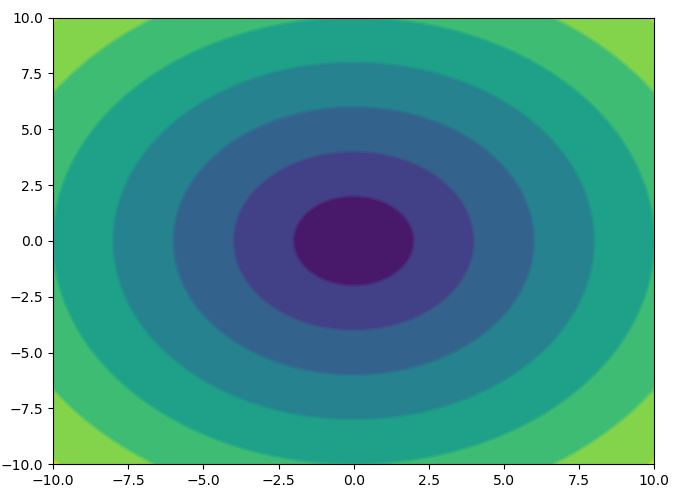
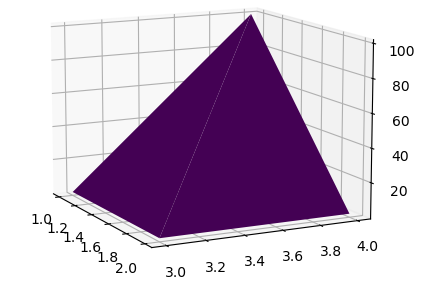
三维图形:
import matplotlib.pyplot as plt
from mpl_toolkits.mplot3d import Axes3D
X=[1,1,2,2]
Y=[3,4,4,3]
Z=[1,100,1,1]
triangles = [[0, 1, 2]]
fig = plt.figure()
ax = fig.add_subplot(111, projection='3d')
ax.plot_trisurf(X, Y, Z, triangles=triangles, cmap='viridis')
plt.show()