大屏中的图表大使用的是开源可视化图表库Echarts
在线编辑:大屏可视化设计器 - 乐吾乐Le5le
使用
1. 在 html 中引入 echarts资源包
<script src="echarts.min.js"></script>
<!-- <script src="https://cdn.bootcdn.net/ajax/libs/echarts/5.1.2/echarts.min.js"></script> -->
2. 注册
import { register as registerEcharts } from "@meta2d/chart-diagram";
registerEcharts();
3. 添加图表图元
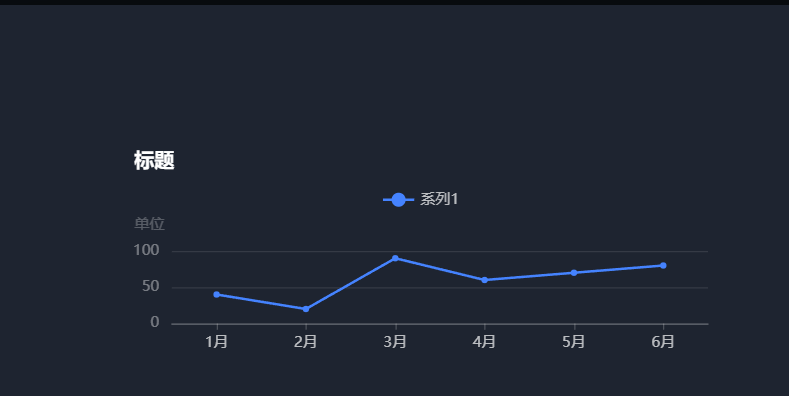
const pen = {name: "echarts",x: 100,y: 100,width: 500,height: 200,externElement: true,disableAnchor: true,echarts: {theme: "le-dark",option: {grid: {bottom: 20,left: 20,right: 20,top: 100,containLabel: true,},title: {text: "标题",textStyle: {fontSize: 16,},padding: 5,top: 16,left: 16},// 图例legend:{data:['系列1'], // 该数组中的内容要与series中的每项的name对应textStyle:{fontSize: 12,},itemWidth: 25,itemHeight: 14,top: 48,padding:5,},// 提示框组件tooltip: {backgroundColor: 'rgba(24,24,24,0.95)',borderColor: 'rgba(24,24,24,0.95)',trigger: 'axis',axisPointer: {type: "shadow"},textStyle: {fontSize: 12,fontWeight: 400}},fontSize: 10,xAxis: {type: 'category',data: ['1月', '2月', '3月', '4月', '5月', '6月'],axisLabel: {fontSize: 12,margin: 10},axisTick:{alignWithLabel:true}},yAxis: {type: 'value',name: '单位',nameGap: 15,nameTextStyle:{fontSize: 12,align:'right',padding:[0,6,0,6]},splitNumber: 2,minInterval: 50,axisLabel: {fontSize: 12,margin: 10,textStyle: {color: '#FFFFFF66', //Y轴内容文字颜色},},},series: [{name:"系列1",type: 'line',data: [40, 20, 90, 60, 70, 80],lineStyle:{width: 2},symbolSize: 5, //小圆点的大小},],},}
};
meta2d.addPen(pen);
meta2d.inactive();
4. 结果
样式修改
选中图表图元,点击数据,点击echarts配置按钮。
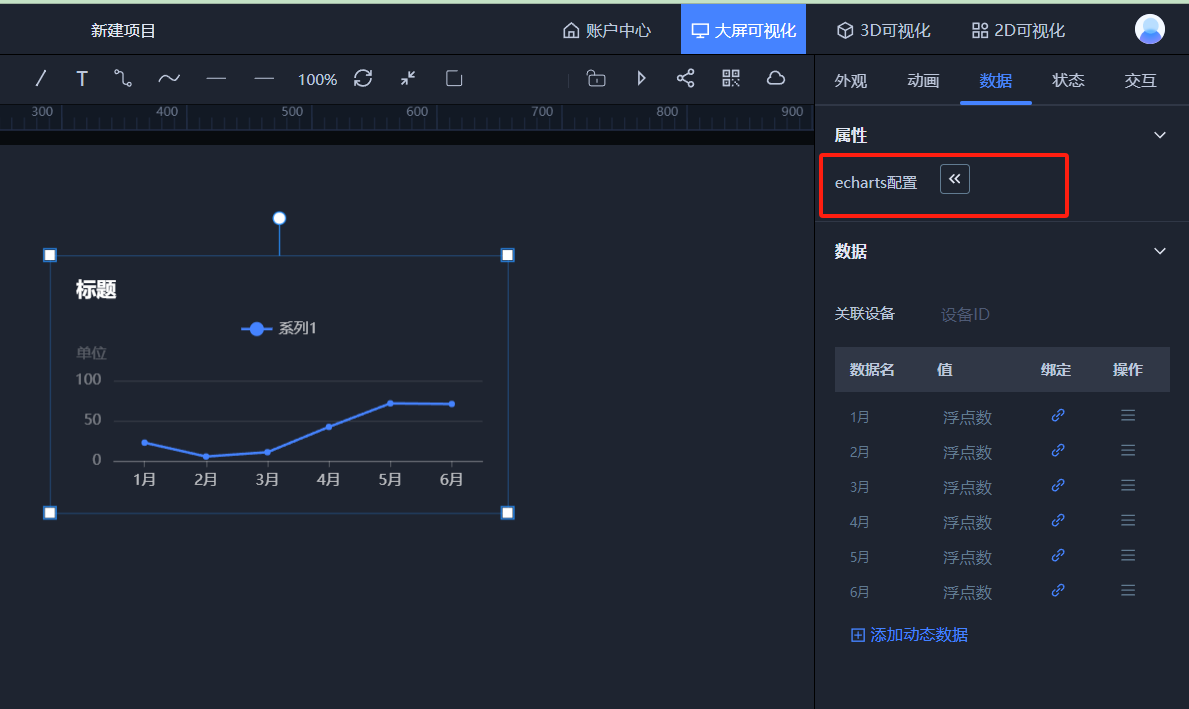
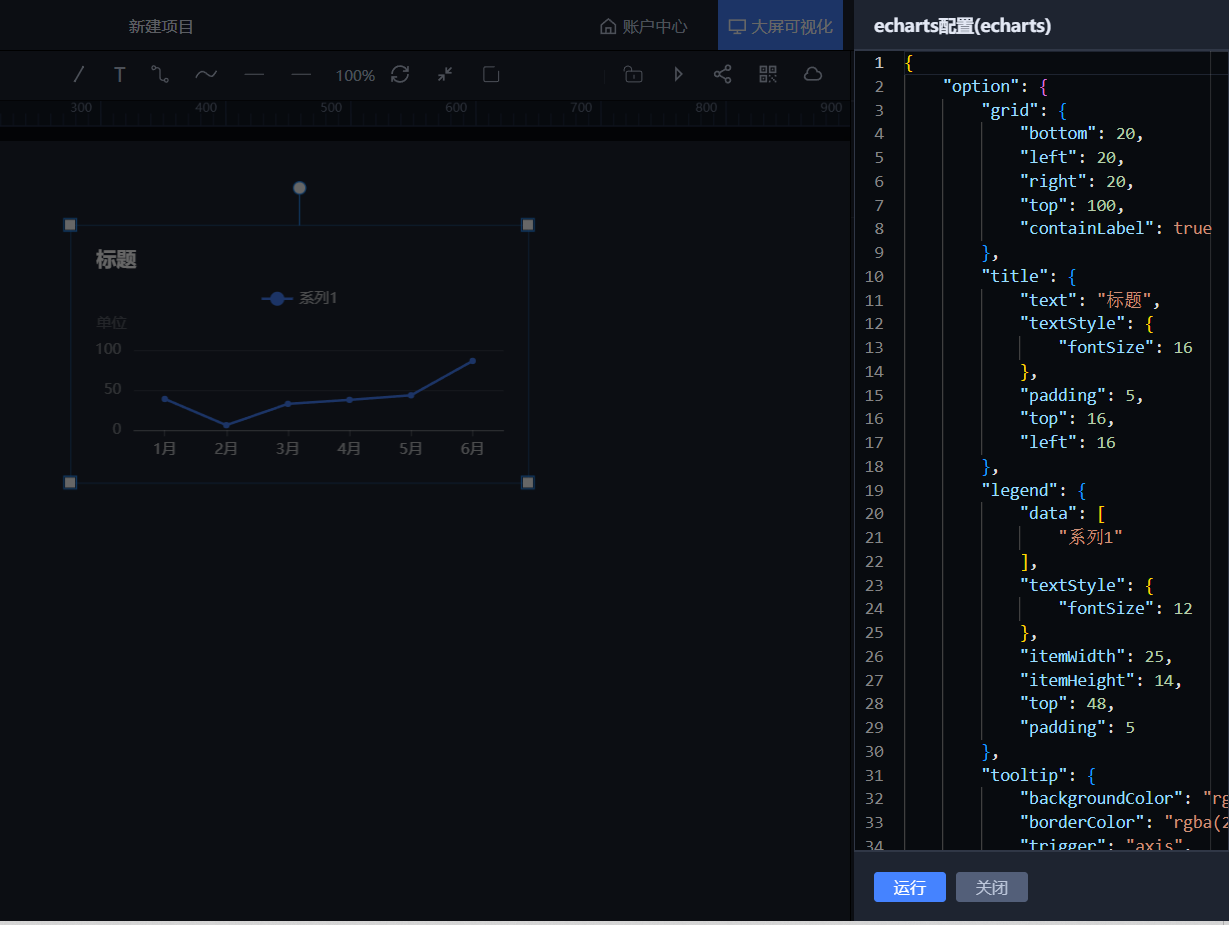
按照echarts官方options配置,修改配置项后,点击运行可以查看效果,确定后点击关闭。
数据更新
const pen = {name: "echarts",x: 100,y: 100,width: 400,height: 300,externElement: true,disableAnchor: true,echarts: {option: {xAxis: {type: "category",data: ["Mon", "Tue", "Wed", "Thu", "Fri", "Sat", "Sun"],},yAxis: {type: "value",},series: [{data: [820, 932, 901, 934, 1290, 1330, 1320],type: "line",},],},},
};
meta2d.addPen(pen);//更新整个数据
meta2d.setValue({id: pen.id,'echarts.option.series.0.data':[11,12,13,14,15,16,17]
});//更新一个数据点
meta2d.setValue({id: pen.id,'echarts.option.series.0.data.2':133
});//更新x轴
meta2d.setValue({id: pen.id,'echarts.option.xAxis.data':['1月','2月','3月','4月','5月','6月','7月','8月','9月','10月','11月','12月']
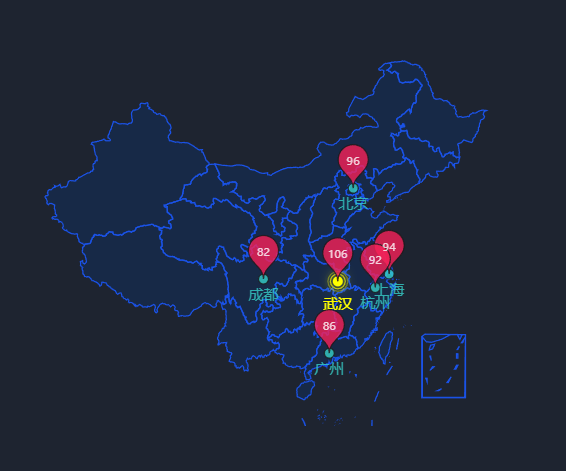
});echarts地图
echarts官方地图文档说明: echarts地图
echarts.geoUrl 是一个请求地图数据的地址(也可以直接配置地图json数据,echarts.geoJson,但是地图数据一般很大,所以不推荐直接配置。)
echarts.geoName 是给geoUrl请求的数据命名,配置这两个数据,meta2d底层就会完成echarts地图的注册。
options.map直接配置geoName就可以了。
//echarts地图
const pen = {name: "echarts",x: 100,y: 100,width: 400,height: 300,externElement: true,disableAnchor: true,echarts: {"geoName":"china",//地图名"geoUrl":"https://assets.le5lecdn.com/v/geo/china.json",//地图数据请求地址,具体数据结构见echarts官网//"geoJson":"...."//地图数据(优先级小于geoUrl)"option":{"tooltip":{},"geo":{"map":"china", //需要注意这里名称要和geoName对应"zoom":1.6,"center":[105,35],"label":{"normal":{"show":false},"emphasis":{"show":false}},"itemStyle":{"normal":{"borderColor":"rgba(26,82,231, 1)","borderWidth":1,"areaColor":"rgba(7, 52, 126, 0.3)"},"emphasis":{"areaColor":"#1677ff80","borderColor":"#1677ff"}}},"series":[{"name":"涟漪散点","tooltip":{"show":false},"type":"effectScatter","coordinateSystem":"geo","data":[{"name":"武汉","value":[114.31,30.52]}],"symbolSize":8,"showEffectOn":"render","rippleEffect":{"brushType":"stroke"},"hoverAnimation":true,"label":{"show":true,"formatter":"{b}","position":"bottom","color":"yellow","offset":[0,4]},"itemStyle":{"normal":{"color":"yellow","shadowBlur":10,"shadowColor":"yellow"}},"zlevel":1},{"name":"散点","tooltip":{"show":false},"type":"scatter","coordinateSystem":"geo","data":[{"name":"北京","value":[116.4551,40.2539]},{"name":"上海","value":[121.4648,31.2891]},{"name":"广州","value":[113.12244,23.009505]},{"name":"杭州","value":[119.5313,29.8773]},{"name":"成都","value":[103.9526,30.7617]}],"symbolSize":8,"label":{"show":true,"formatter":"{b}","position":"bottom","color":"#36cfc9","offset":[0,-2]},"itemStyle":{"normal":{"color":"#36cfc9"}},"zlevel":1},{"name":"数据","tooltip":{"formatter":"{b}"},"animation":false,"type":"scatter","coordinateSystem":"geo","symbol":"pin","symbolSize":40,"label":{"normal":{"show":true,"formatter":"{b}","textStyle":{"color":"#fff","fontSize":9}}},"itemStyle":{"normal":{"color":"#F62157"}},"zlevel":6,"data":[{"name":106,"value":[114.31,30.52]},{"name":96,"value":[116.4551,40.2539]},{"name":94,"value":[121.4648,31.2891]},{"name":86,"value":[113.12244,23.009505]},{"name":92,"value":[119.5313,29.8773]},{"name":82,"value":[103.9526,30.7617]}]}]},"theme":"le-dark"}
}
meta2d.addPen(pen);
结果: